Dispatch Dashboard
Dispatch Dashboard
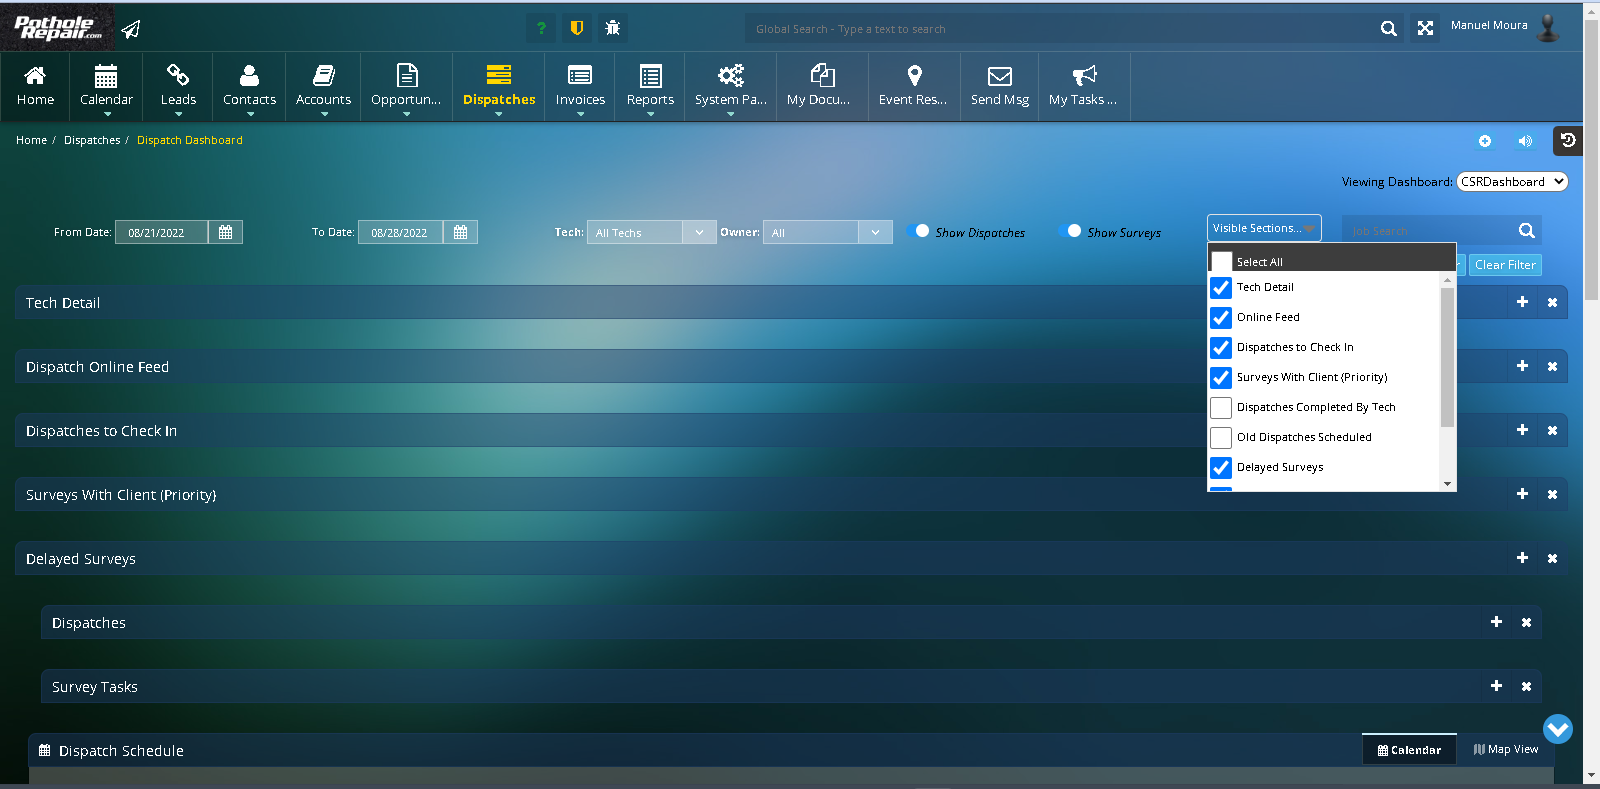
This is the dispatch dashboard, where we handle everything involving planning and scheduling of dispatches and surveys.
Inside it we can see all the different sections with specific information that can be turned on and off, or minimized, depending on what the user is working on at that moment. All the information is directly attached to the dates in the top left of the dashboard. The system will set this date range to the current week automatically and the user can change it manually to its preference.
Sections
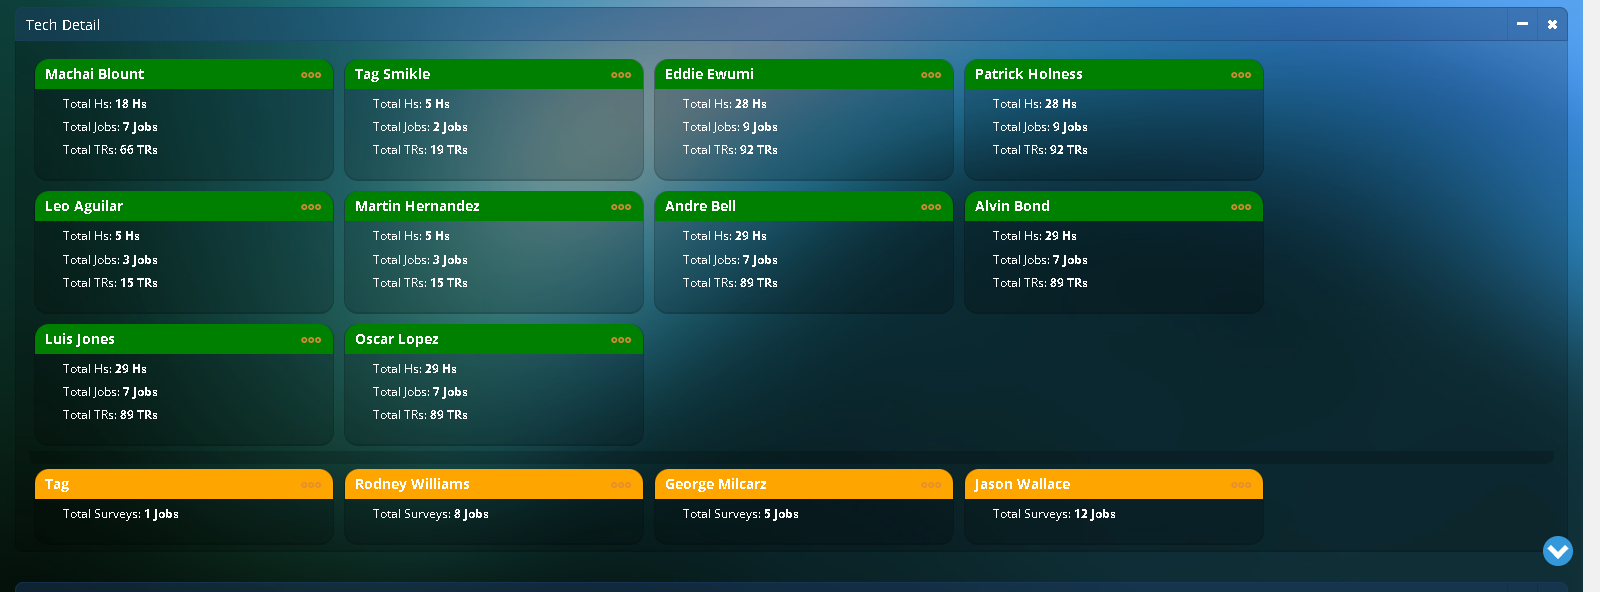
Tech detail – Here we can see the detail of how many TRs, hrs and jobs each tech is scheduled for in the time frame provided in the filter. We can also see how many surveys each surveyor is assigned. Inside each user’s box we have a three-dot button that will open the detail involving all this information.
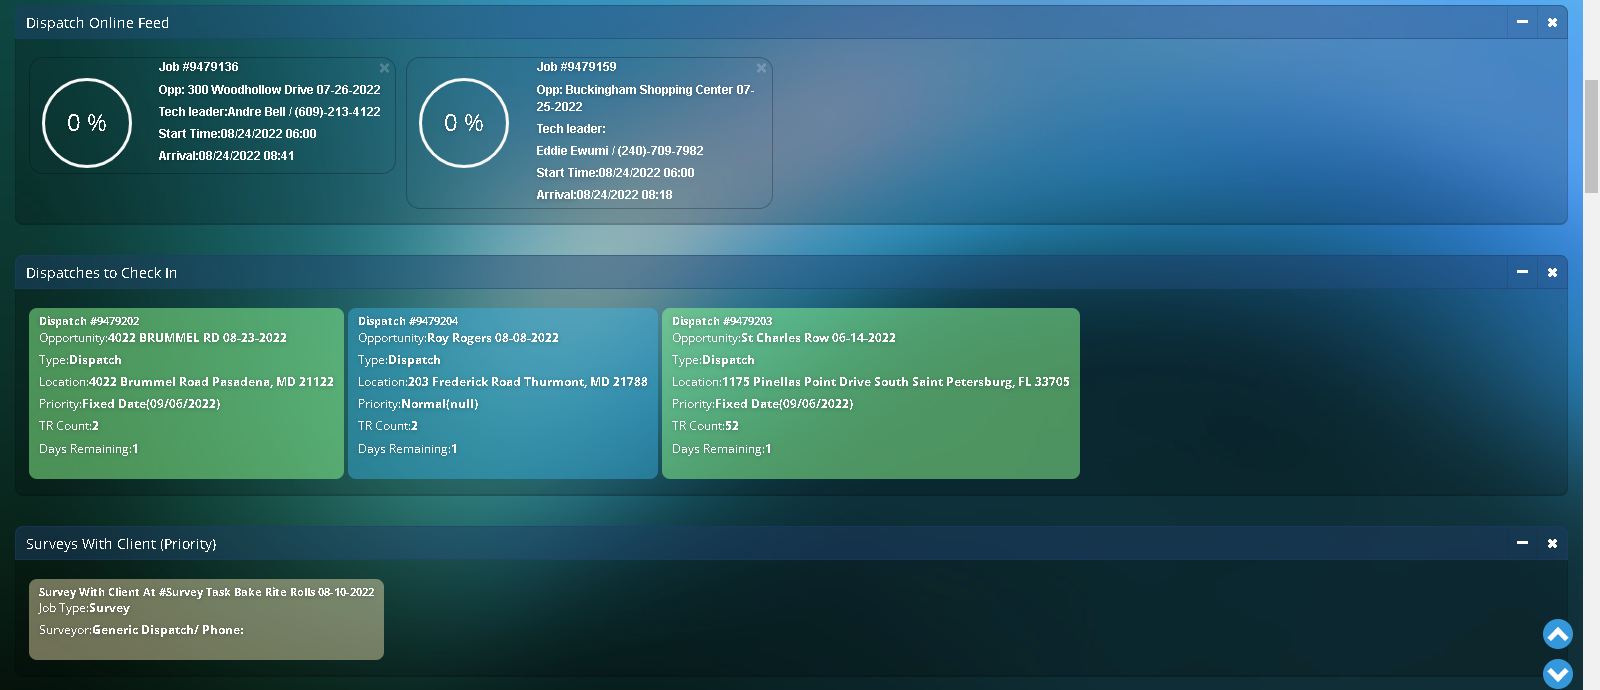
Dispatch online feed – Here we can se the current jobs being done and the percentage of TR completion at the moment. Dispatches to check in – Here we see the jobs that have already been sold and are waiting for administration to check in. Surveys with client – This section shows the surveys with client (priority over regular surveys) that are waiting to be scheduled. This kind of surveys need to be scheduled and coordinated with the client within 24hrs since it was added in the system.
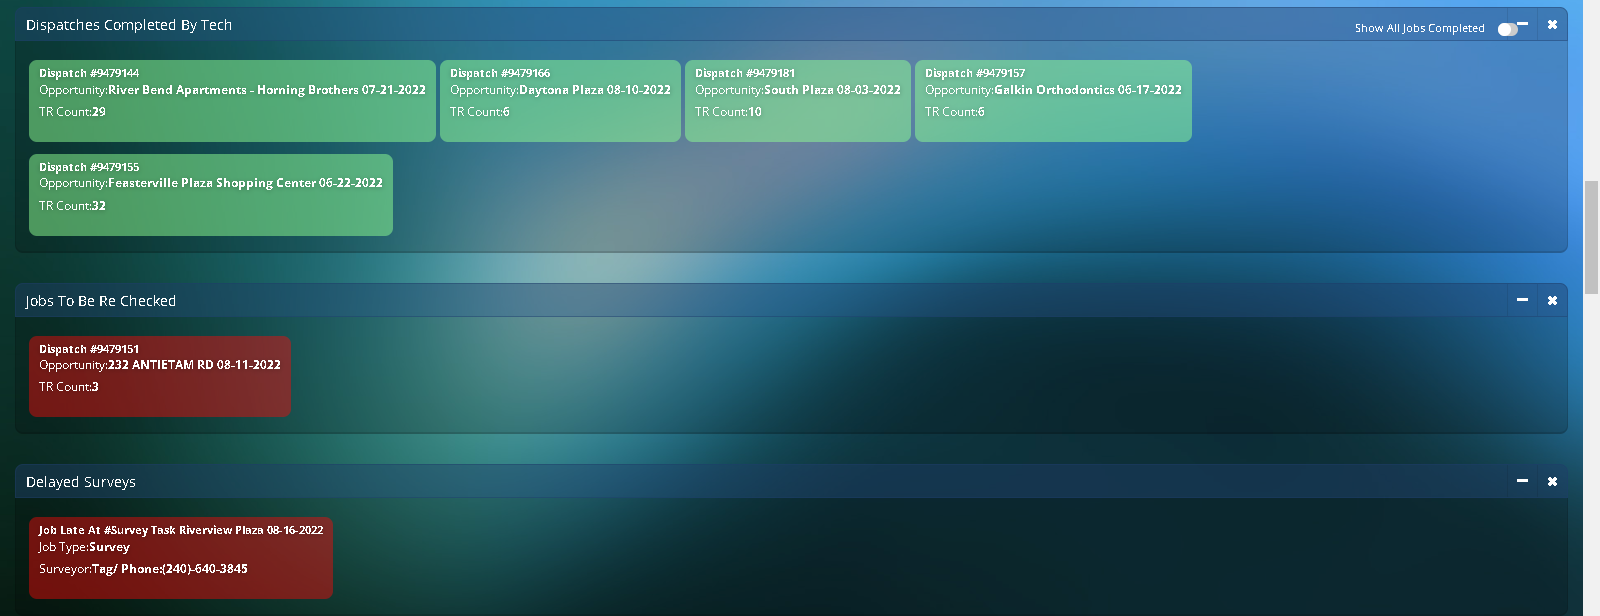
Dispatches completed by tech – Here we can see the jobs that have already been completed and are waiting to be invoiced.
Jobs to be rechecked – Here we see the jobs that had a scheduled date before the current date and haven’t been completed, so we need to get them back in the schedule for completion.
Delayed surveys – This section shows the surveys that are currently scheduled but delayed.
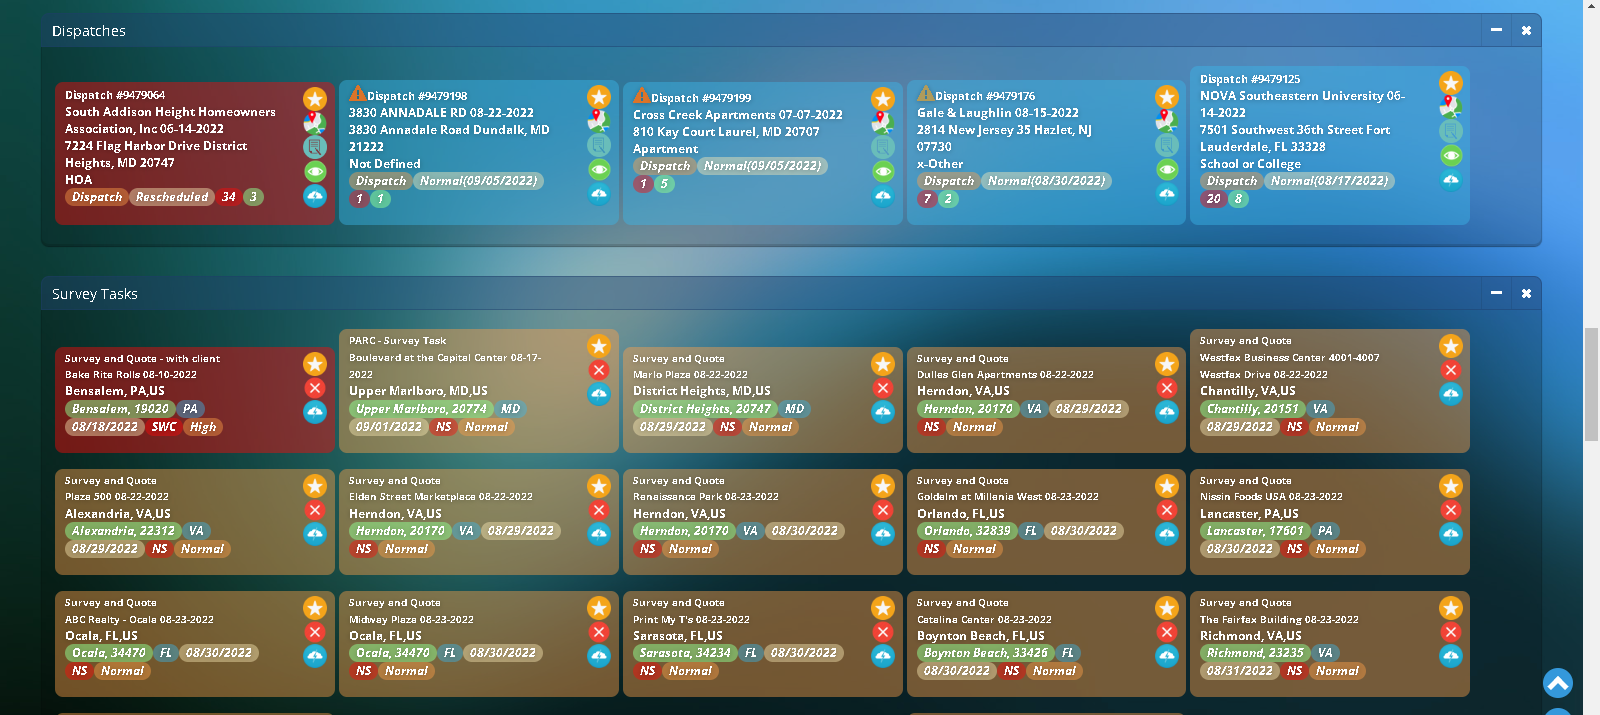
Dispatches – Here we see the dispatches that are yet to be scheduled. They will show in this list in the order that they were created, except for jobs that have been rescheduled, which will show first and in red color. Blue ones are regular dispatches and green ones are fixed date dispatches. Inside each box we will see the specific dispatch information: Dispatch number, address, property type, TRs, and days in the system. We also have different buttons that will provide us with useful information when scheduling the jobs: Star button will show the nearest scheduled jobs. Map button will show the location with the location of each repair. Notes button will show all the surveyor and manager notes. Eye button will show the damage pictures. Cloud button will show the weather for that area in the next hours and days. Surveys – This section shows all the surveys waiting to be scheduled. In this list, WWC surveys will show on top and in red color. Inside each box we will see the specific survey information. Star button will show closest scheduled surveys. Red cross will dismiss the task. Cloud button will show the weather in that area.\
Calendar
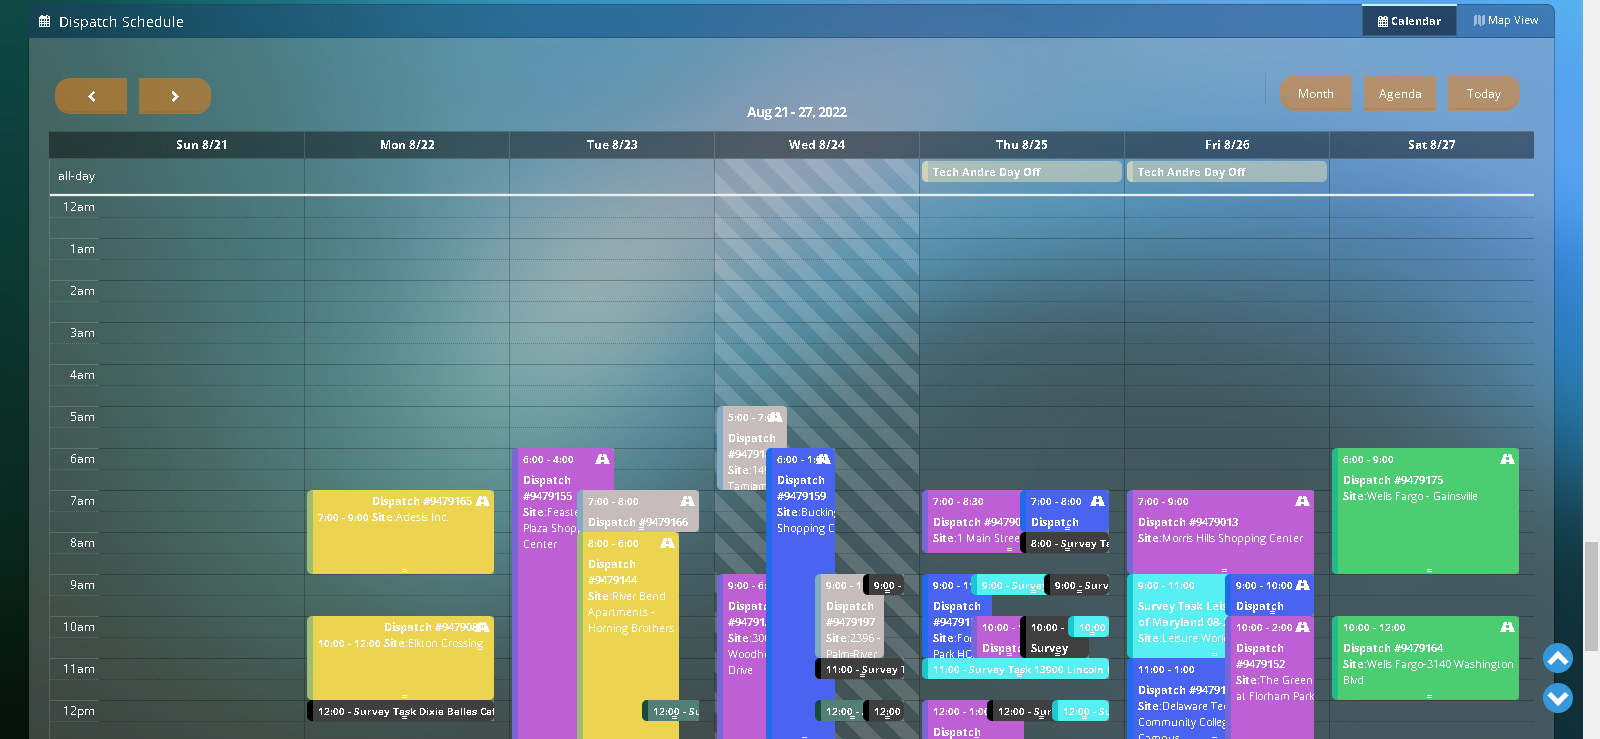
Inside the calendar we will see everything that is scheduled (dispatches and surveys) within the current week. We can color code each team of technicians to our preference, and surveyors will always show the same color. Dispatches will show a small ‘Road’ icon in the top right corner, and surveys will show a small ‘Car’ icon in the same area.
Map view
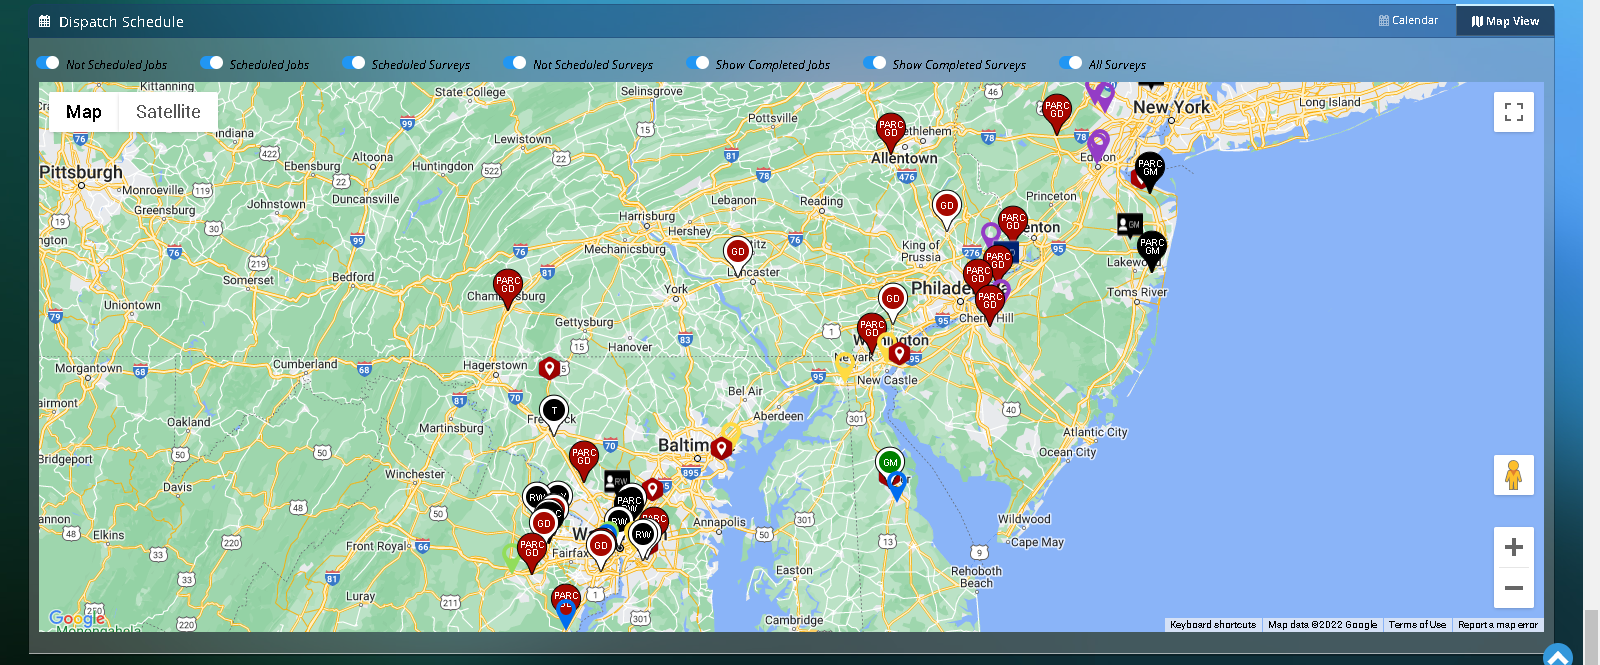
In this view we will see all the information reflecting the dates in the filter on top of the dashboard. There are many different icons inside this view: Red hexagon: Dispatches to be scheduled. Color pointer: Scheduled dispatches with team color. Red pointer PARC GD: Parc surveys to be scheduled. Red pointer with white outline GD: General Dispatch surveys to be scheduled. Blue Square GD: Walk with client surveys to be scheduled. Once the surveys have been scheduled, the icon will turn black and show the surveyor’s initials inside it. If the surveyor has not completed the survey inside the time frame set in the system, the icon will turn to pink color. All these icons are clickable and will show more detailed information in addition to the dispatch and survey sections.
